Variance Finance Wiki
Variance in Finance: Understanding Risk and Volatility
In the realm of finance, variance is a fundamental statistical measure that quantifies the degree of dispersion of a set of values around their mean. It provides crucial insights into the risk and volatility associated with investments, portfolios, and even entire markets.
Calculating Variance
Variance is calculated by finding the average of the squared differences between each data point and the mean. This squaring ensures that all deviations from the mean contribute positively, preventing negative and positive deviations from canceling each other out. A higher variance indicates greater dispersion and, consequently, higher risk.
The mathematical formula for calculating variance for a sample is:
σ² = Σ(xi - μ)² / (n-1)
Where:
- σ² is the sample variance
- xi is each individual data point
- μ is the sample mean
- n is the number of data points in the sample
Applications in Finance
Variance plays a critical role in several key areas of finance:
- Risk Management: A high variance signifies greater potential for both positive and negative returns, implying higher risk. Investors use variance to assess the potential downside of an investment and make informed decisions about risk tolerance.
- Portfolio Optimization: Variance is a key input in portfolio optimization models, such as the Markowitz model. By considering the variance of individual assets and their correlations, investors can construct portfolios that maximize returns for a given level of risk or minimize risk for a given level of return.
- Performance Evaluation: Variance, along with mean return, is used to evaluate the performance of investment managers. Risk-adjusted return metrics, like the Sharpe ratio, incorporate variance to assess whether the manager's returns are commensurate with the level of risk taken.
- Options Pricing: Variance is a key parameter in options pricing models, such as the Black-Scholes model. Volatility, which is the square root of variance (i.e. standard deviation), directly impacts the price of options. Higher volatility leads to higher option prices.
- Market Analysis: Tracking the variance of market indices can provide insights into overall market sentiment and potential future price movements. Sudden increases in variance may signal increased uncertainty and potential market corrections.
Limitations
While variance is a valuable tool, it has limitations. It treats both positive and negative deviations from the mean equally, failing to differentiate between upside and downside risk. Furthermore, variance alone doesn't capture the shape of the distribution. It assumes a normal distribution, which may not always hold true for financial assets. Other measures like skewness and kurtosis are needed to fully understand the risk profile of an investment.
Standard Deviation
Standard deviation, the square root of variance, is often used interchangeably with variance. Standard deviation has the advantage of being expressed in the same units as the original data, making it easier to interpret. It provides a more intuitive measure of the typical deviation from the mean.
Conclusion
Variance is a powerful statistical tool essential for understanding and managing risk in finance. It helps investors, portfolio managers, and analysts make informed decisions by quantifying the volatility and potential range of outcomes associated with various investments and market conditions. While not without its limitations, variance remains a cornerstone of modern financial analysis.
 1183×670 calculate variance mathsathomecom from mathsathome.com
  1280×854 variance calculator steps calculator from www.inchcalculator.com
 :max_bytes(150000):strip_icc()/Variance-TAERM-ADD-V1-273ddd88c8c441d1b47f4f8f452f47b8.jpg) 1500×1003 variance statistics definition formula from www.investopedia.com
1500×1003 variance statistics definition formula from www.investopedia.com  1200×800 variance formula from fity.club
 :max_bytes(150000):strip_icc()/latex_104ab167efe3f6e76039876d42dfde0e-5c5b1b7746e0fb00017dcf53.jpg) 1280×640 variance definition from www.investopedia.com
1280×640 variance definition from www.investopedia.com  0 x 0 calculate variance youtube from www.youtube.com
  1024×768 measures variability powerpoint from www.slideserve.com
 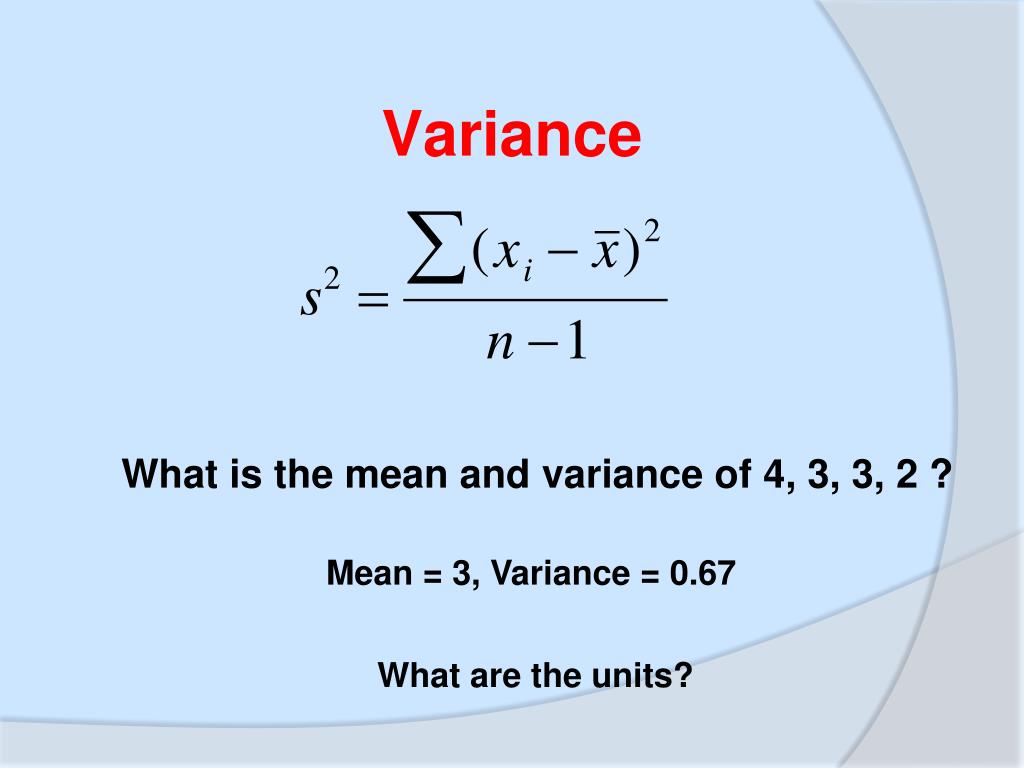 1024×768 statistics review powerpoint id from www.slideserve.com
  0 x 0 variance standard deviation level maths statistics youtube from www.youtube.com
  857×424 variance definition formula examples properties from www.cuemath.com
  1024×526 calculating variance continuous variables vxy ross anionvely from rossanionvely.blogspot.com
  3200×2400 como calcular la varianza pasos imagenes from es.wikihow.com
 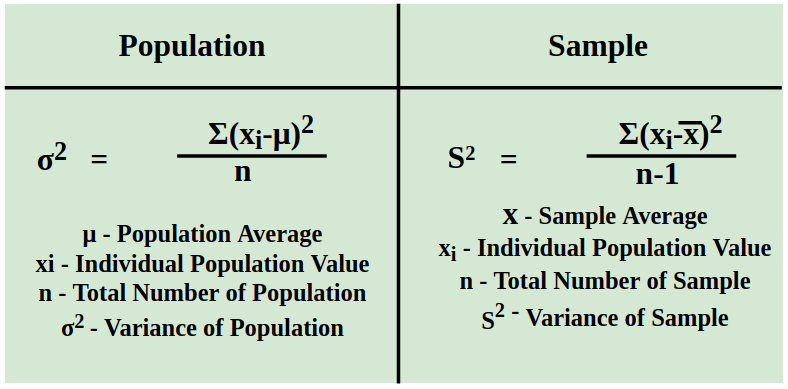 474×233 variance geeksforgeeks from www.geeksforgeeks.org
  1024×768 statistics research ecology from slideplayer.com
  1024×724 variance definition variance from www.worksheetsplanet.com
  1000×1000 variance magic general magic fundamentals mtg salvation from www.mtgsalvation.com
  2560×1920 exploring variance deviation research articles from www.slideserve.com
  1024×622 variance machine learning definition variance deviation from medium.com
  1024×768 standard deviation variance notes thomas olsen blog from cexfmgws.blob.core.windows.net
 :max_bytes(150000):strip_icc()/varianceinExcel2-54b70f5be0f440ddbf7f9b17b0314469.png) 6251×3959 variance excel calculate from www.investopedia.com
6251×3959 variance excel calculate from www.investopedia.com  993×467 sample variance simple definition find easy steps from www.statisticshowto.com
  800×592 variance wikipedia from en.wikipedia.org
  2686×1342 variance explained modeling mued from bookdown.org
 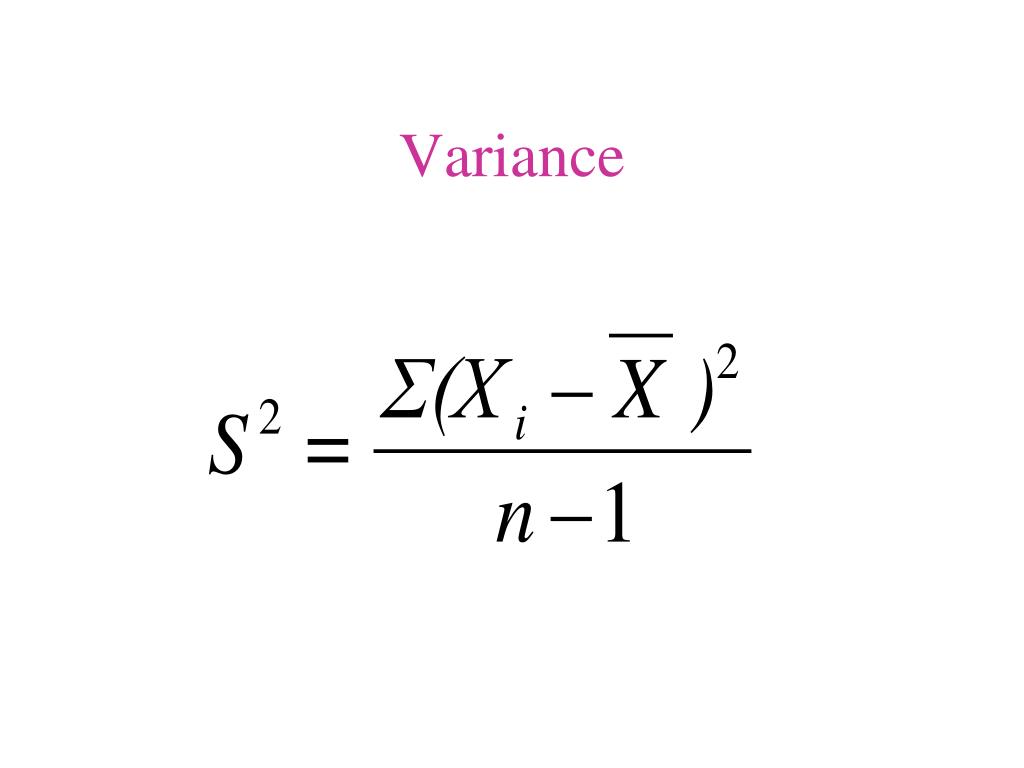 1024×768 variance from fity.club
 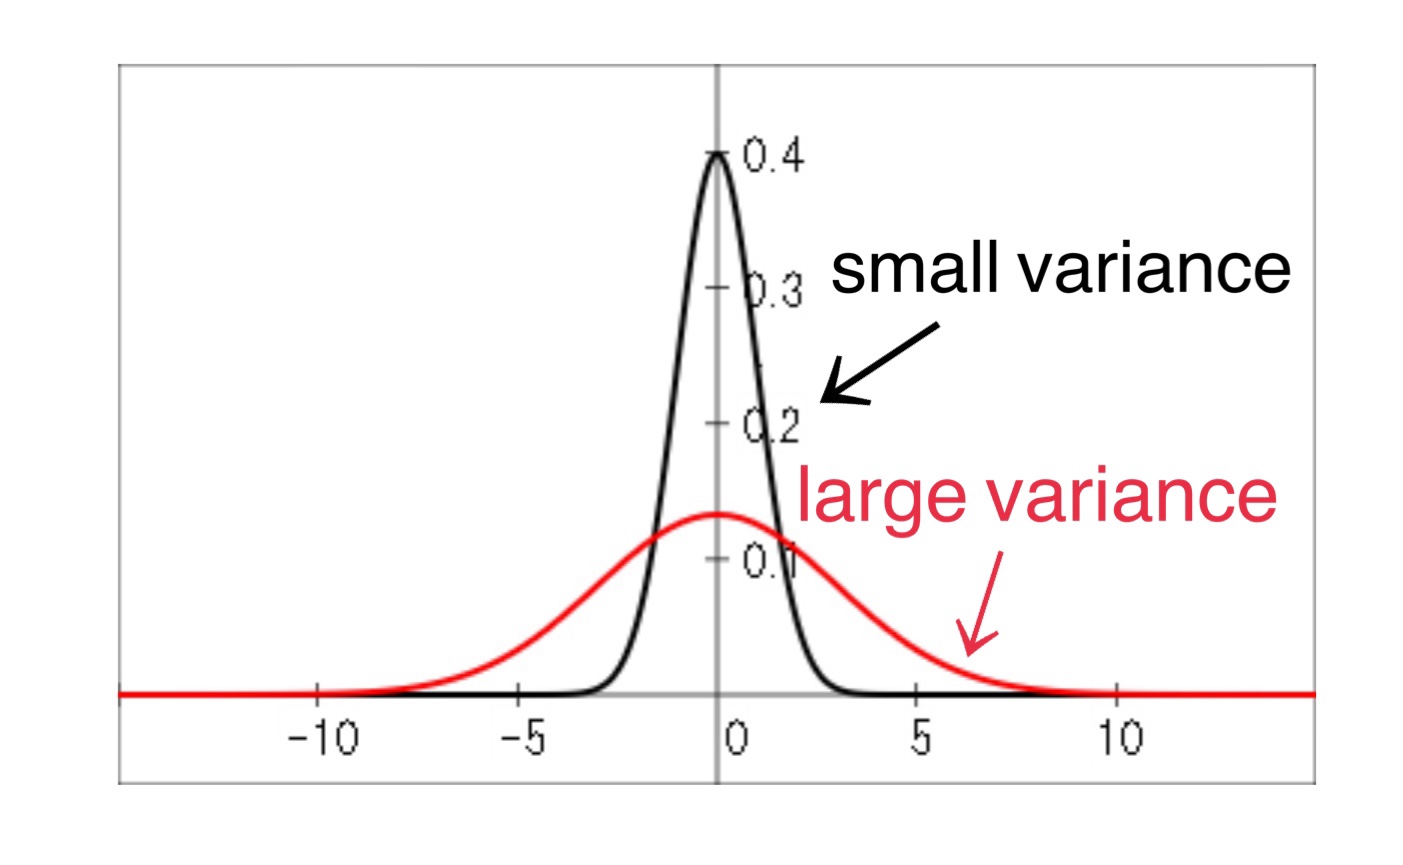 1403×865 difference variation variation from quizunknowable.z21.web.core.windows.net
  942×728 variance standard deviation from www.slideshare.net
  960×720 measures variablility howmed from howmed.net
 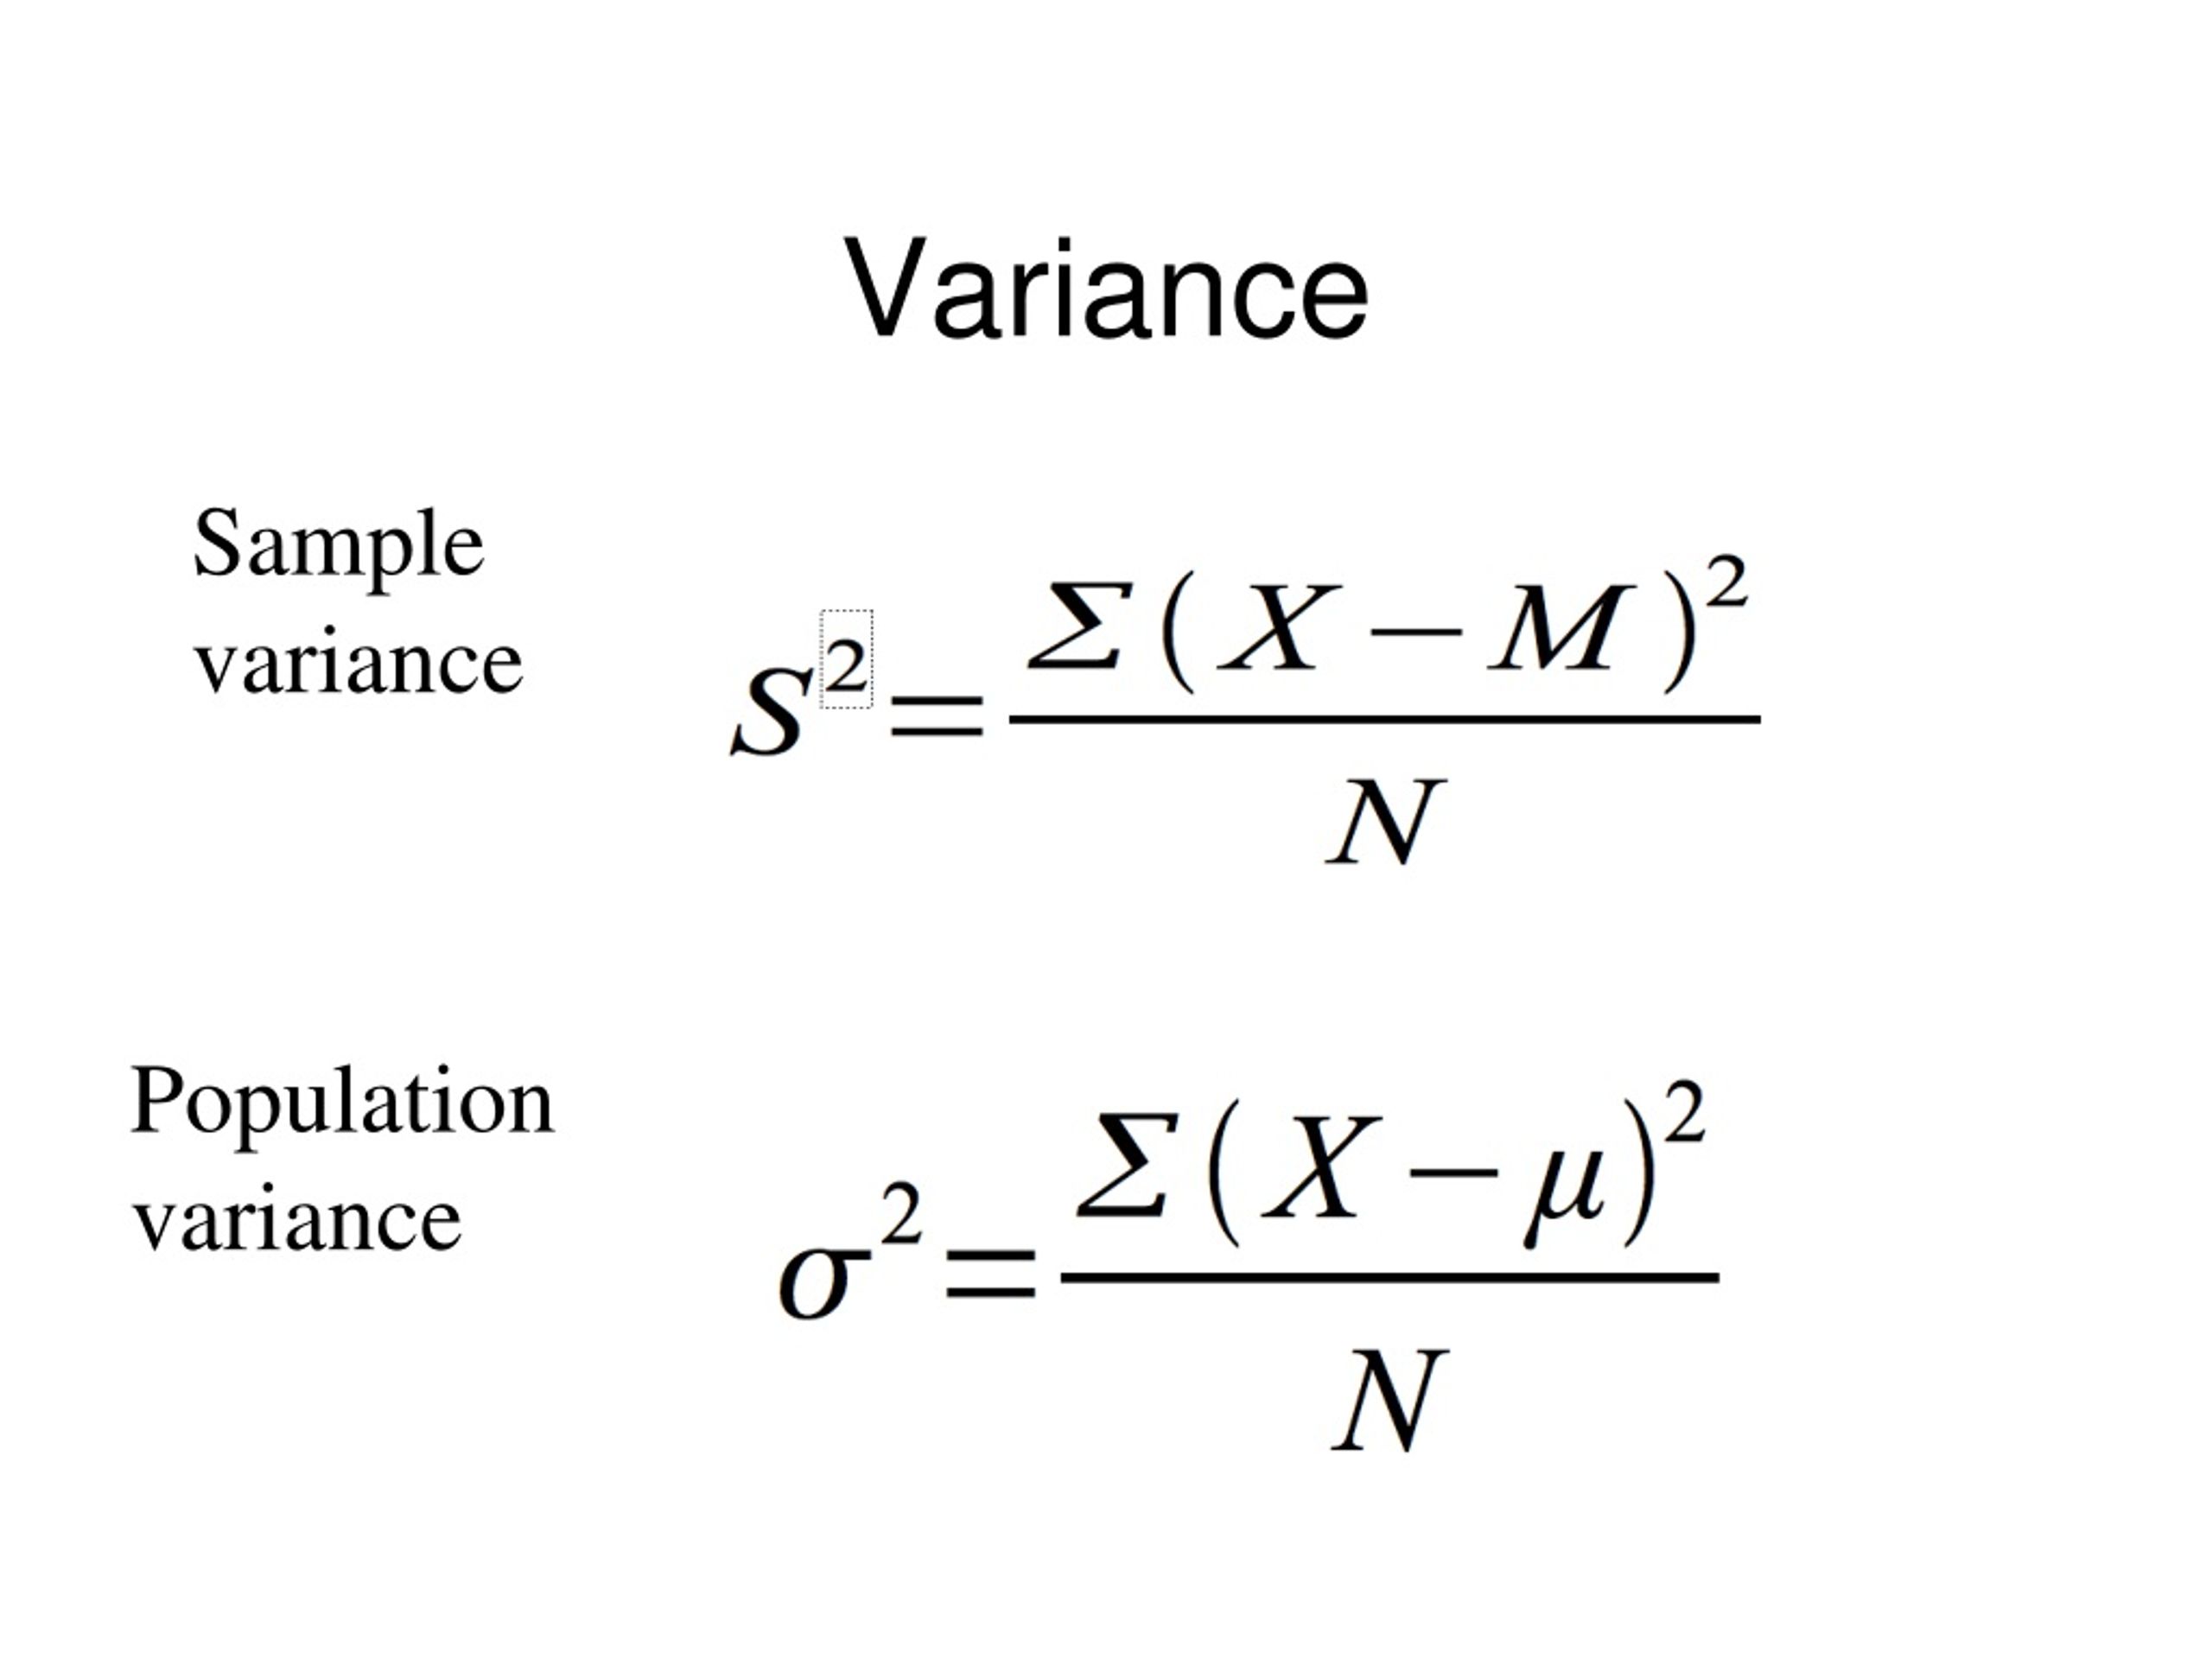 2560×1920 variance standard deviation scores powerpoint from erofound.com
  1920×1080 coefficient de variation from pdfprof.com
